Perio Chart Overview
|
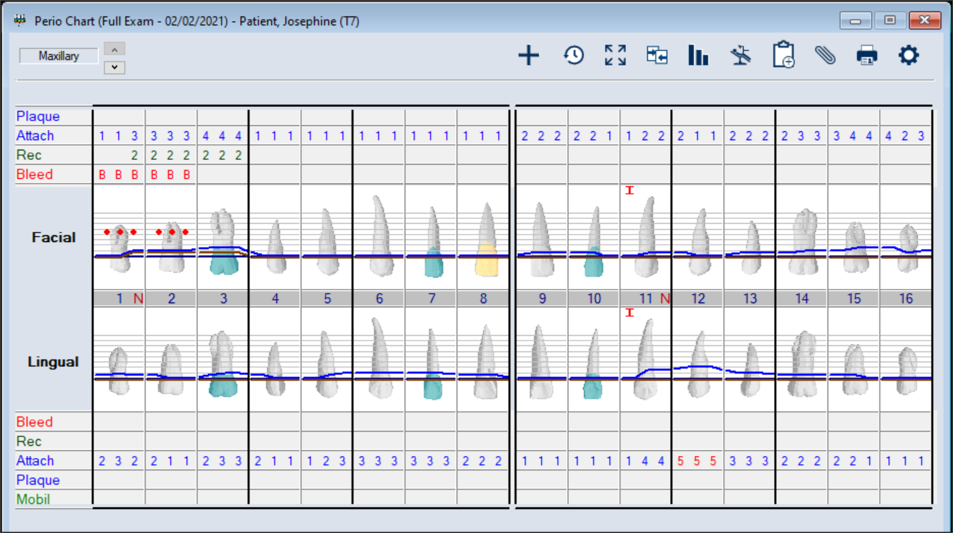
The Perio Chart module is used to record the state of a patient’s periodontal health by charting conditions of the mouth and gums such as pocket depths, plaque, and bleeding. The module displays the values graphically or textually on a 3D image of the patient’s teeth, enabling you to compare data over time as you determine an appropriate course of treatment. Because different users have different perio charting needs and methods, the module is highly customizable and providers, provider types, charting conditions, and charting methods are set up to suit your institution’s practices. The module also displays PSR (Periodontal Screening and Recording) scores that are used as a diagnostic tool for the early detection of periodontal disease. You can enter PSR scores manually or let axiUm calculate them automatically. You can also enter and view perio treatment and EPR forms. You can directly open the Perio Chart module using one of the following methods:
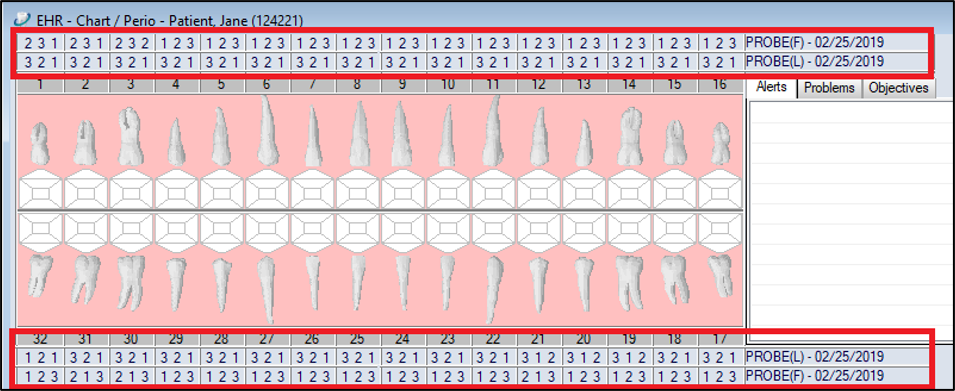
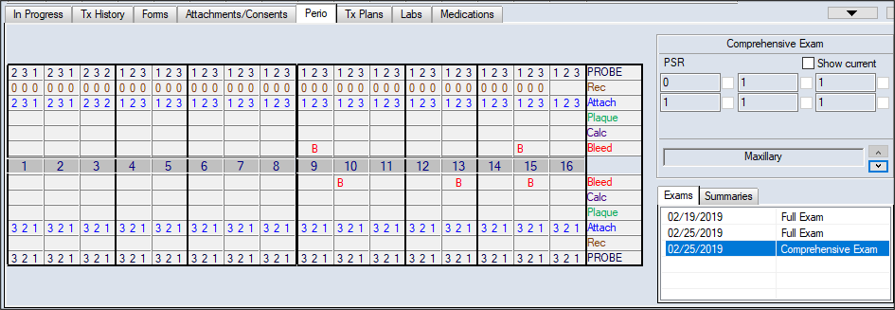
You can also access a patient’s current chart, previous exams, and other perio functionality from two places within the EHR module: the odontogram and Perio tab.
Note: Workflow is based on the Perio Chart module unless otherwise specified. When the Perio Chart module is first accessed, the Perio Chart window opens by default and the most recent perio exam results display as the patient’s current chart. The Perio Chart window is comprised primarily of a 3D image of the patient’s teeth and offers a variety of icons to complete perio tasks. Note: The Perio Chart module is customizable and its layout can vary based on your institution’s configuration.
The toolbar includes Up and Down ( You can run two custom reports from the Info Manager module > Clinical tab to pull information from the Perio Chart module. You can use these reports the same as other Info Manager reports. You can customize, create, filter, save, and print or export them.
|